


April 29, 2009
Via Zero Hedge, here is a graph of the spread between Mortgages and the US Treasury 10-year bonds:
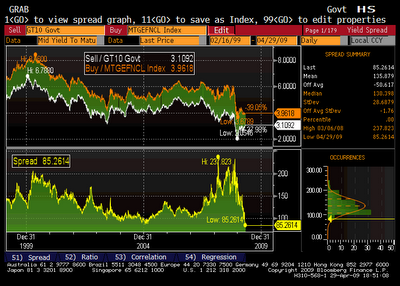
Due to the Fed's buying of Mortgage Backed Securities, this spread is now at an all time low. This is completely insane. One of the main reasons we are in this financial mess is because of a complete lack of risk evaluation during the lending process. This chart indicates that, thanks to actions by the Fed, we are now willing to lend more recklessly than ever in an attempt to keep the party going.
Look closely at the progress of the chart. As the economy was turning at the start of the dot.com collapse, the Fed (under Greenspan) flooded the market with cash. A lot of that cash obviously found its way into home mortgages as the spread narrowed quickly from a recessionary 200 bps to just above 100 bps.
Then, during the second half of 2002, the market attempted to return to a more normal state of affairs at around 150bps. However, instead of stabilizing, with the Fed apparrantly unable to get rid of the excess money in the system, the spread quickly collapsed again, bottoming out at under 100 bps in the beginning of 2005. This, of course, aligns quite neatly with the peak of the home-loan insanity, when anyone who could fog a mirror could get a mortgage for pretty much any amount they liked.
Then, as things started to implode, this spread widened out again to around 200bps. Note that if the market had truly overreacted, this spread should have shot up a lot more to compensate lenders for the increased risk of lending in a highly recessionary environment. All the market did was try to price in an appropriate amount of risk, and return to some semblance of sanity in lending standards.
But the financial oligarchy wouldn't have any of that! Instead, the Fed has crushed this spread right back down, to such an extent that, from a credit-risk perspective, we're now even worse off than we were in 2005. Anyone who thinks this could possibly end well is a complete and utter moron. Mortgaging the future, indeed.
Posted by: Hermit Dave at
07:47 PM
| No Comments
| Add Comment
Post contains 366 words, total size 2 kb.
April 09, 2009
On January 16th, the last trading day prior to Obama's inauguration, the market levels were 8281, 844, and 1529 for the Dow, S&P 500, and Nasdaq indicies respectively. Â During the subsequent fall to their March lows, conservative blogs continually pointed at the collapse in these indicies as proof that Obama's financial policies were a disaster.
Today, after rallying for about a month, these same indicies closed at 8083, 857, and 1653. Â Unsurprisingly, the vast majority of conservative blogs have stopped talking about the index levels. Â Using their previous logic, Obama would have to get credit for somehow reversing the course of the markets such that they're now above (on balance, the Dow being the narrowest index) where they were prior to his inauguration.
In fact, if I were a typically idiotic lefty blogger, I'd be trying to give Obama credit for the entire rally, while laying the sell-off at Bush's feet. Â It wouldn't be too hard to make a seemingly good case that the markets sold off due to Obama's honesty in detailing the trouble Bush left us in, but then rallied due to his approach to the situation.
Do I actually believe this? Â Of course not. Â Of course, I didn't believe that Obama's policies had much to do with the sell-off either. Â The only extent to which Obama should get credit in either direction is the initial uncertainty about his policies (Geithner running around like a chicken with his head cut off), followed by some indication of a plan (the quality of the plan is largely immaterial in the short term). Â Markets hate uncertainty, and short of Obama saying he was going to nationalize everything and wipe out the equity holders, they were going to rally on any semblance of organization in the new administration's approach to the financial situation.
The lesson? Â Most bloggers know nothing about markets and should stick to discussion of policy rather than pointing to index levels when they seem to support their positions.
Posted by: Hermit Dave at
04:07 PM
| No Comments
| Add Comment
Post contains 339 words, total size 2 kb.
42 queries taking 0.0422 seconds, 81 records returned.
Powered by Minx 1.1.6c-pink.

